A | B | C | D | E | F | G | H | CH | I | J | K | L | M | N | O | P | Q | R | S | T | U | V | W | X | Y | Z | 0 | 1 | 2 | 3 | 4 | 5 | 6 | 7 | 8 | 9
 Industries of the Republic of Ghana | |
| Currency | Cedi (GHS, GH₵) |
|---|---|
| Calendar year | |
Trade organisations | AU, AfCFTA, WTO, ECOWAS |
Country group |
|
| Statistics | |
| Population | |
| GDP | |
| GDP rank | |
GDP growth | |
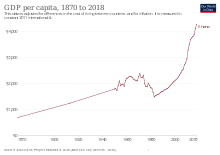
GDP per capita | |
GDP per capita rank | |
GDP by sector |
|
Population below poverty line | |
| 43.5 medium (2016)[12] | |
| Unemployment | |
Main industries | mining, lumbering, light manufacturing, aluminum smelting, food processing, cement, small commercial ship building, petroleum |
| External | |
| Exports | |
Export goods | fuels including oil, gems, precious metals, cocoa, fruits, nuts, ores, slag, ash, animal/vegetable fats, oils, waxes, wood, rubber, rubber articles, meat/seafood preparations aluminum
|
Main export partners |
|
| Imports | |
Import goods | refined petroleum, cars, rice, delivery trucks, coated-flat rolled iron, other foodstuffs |
Main import partners |
|
FDI stock | |
Gross external debt | |
| Public finances | |
| 2.0% (of GDP) (2022 est.)}[21] | |
| Revenues | 9.544 billion (2017 est.)[8] |
| Expenses | 24.5% of GDP (2023 est.)[23] |
| |
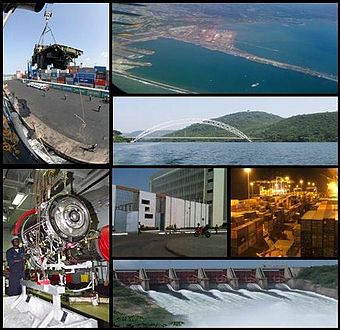
The economy of Ghana has a diverse and rich resource base, including the manufacturing and exportation of digital technology goods, automotive and ship construction and exportation, and the exportation of diverse and rich resources such as hydrocarbons and industrial minerals. These have given Ghana one of the highest GDP per capita in West Africa.[27][28] Owing to a GDP rebasement Ghana became the fastest-growing economy in the world in 2011.[29]
The Ghanaian domestic economy in 2012 revolved around services, which accounted for 50% of GDP and employed 28% of the work force. Besides the industrialization associated with minerals and oil, industrial development in Ghana remains basic, often associated with plastics (such as chairs, plastic bags, razors, and pens).[30] 53.6% of Ghana's workforce were employed in agriculture in 2013.[31][32]
Ghana embarked on a currency re-denomination exercise, from the Cedi (₵) to the new currency, the Ghana Cedi (GH₵) in July 2007. The transfer rate is 1 Ghana Cedi for every 10,000 Cedis.
Ghana is Africa's largest gold producer, after overtaking South Africa in 2019, [33] and the second-largest cocoa producer (after Ivory Coast).[34] It is also rich in diamonds, manganese or manganese ore, bauxite, and oil. Most of its debt was canceled in 2005, but government spending was later allowed to balloon. Coupled with a plunge in oil prices, this led to an economic crisis that forced the government to negotiate a $920 million extended credit facility from the International Monetary Fund (IMF) in April 2015.[35]
Taxation
Value-added tax is a consumption tax administered in Ghana. The tax regime that started in 1998 had a single rate but since September 2007 entered into a multiple rate regime. In 1998, the rate of tax was 10% and amended in 2000 to 12.5%. The top income tax and corporate tax rates are 25%. Other taxes included with value-added tax (VAT), are the national health insurance levy, and a capital gains tax. The overall tax burden was 12.1% of Ghana's total domestic income in 2013. Ghana's national budget was the equivalent of 39.8% of GDP in 2013.[36] Ghana is implementing the rent tax in 2021.
Manufacturing
Ghana's industrial base is relatively advanced. Import-substitution industries include electronics manufacturing. Rlg Communications is the first indigenous African company to assemble laptops, desktops, and mobile phones, and is West Africa's biggest information and communications technology (ICT) and mobile phone manufacturing company.[37]
Ghana began its automotive industry with the construction of a prototype robust SUV, named the SMATI Turtle 1, intended for use in the rough African terrain. It was designed and manufactured by the Artisans of Suame Magazine Industrial Development Organization. Urban electric cars have been manufactured in Ghana since 2014.[38][39]
As of 2012 there were four major companies in the textiles sector: Akosombo Textiles Limited, Tex Style Ghana Limited, Printex Ghana, and Ghana Textile Manufacturing Company.[40]
Ghana National Petroleum Corporation and Ghana Oil Company deal with crude oil and gas exploration, exploitation, and refining.[41]
Telecommunications
At the end of January 2022, total number of voice subscription in Ghana stood at 41,380,751.This represents a percentage increase of 1.28% over December 2019 figures of 40,857,007. The total penetration rate stands at 136.79%. Competition among mobile-phone companies in Ghana is an important part of the telecommunications industry growth, Current market leader MTN with voice subscription of 23,150,485 representing 55.95% of the market is followed by Vodafone with voice subscription of 9,075,795 representing 21.93% market share, AirtelTigo voice subscription stands at 8,428,322 representing 20.69%, Glo's current voice subscription stands at 726,149 which represent a market share of 1.75%.[42][43][44]
The mass media of Ghana is among the most liberal in Africa, with Ghana ranking as the third-freest in Africa and 30th-most free in the world on the worldwide press freedom index. Chapter 12 of the Constitution of Ghana guarantees freedom of the Ghanaian press and the independence of the mass media, and Chapter 2 prohibits censorship.[45] Ghanaian press freedom was restored in 1992.[45]
Ghana was one of the first countries in Africa to achieve the connection to the World Wide Web.[46] In 2010, there were 165 licensed internet service providers in Ghana and they were running 29 of the fiber optic, and authorized networks VSAT operators were 176, of which 57 functioned, and 99 internet operators were authorized to the public, and private data and packet-switched network operators were 25.[47]
Data


The following table shows the main economic indicators in 1980–2017. Inflation below 5% is in green.[48]
| Year | GDP (in bil. US$ PPP) |
GDP per capita (in US$ PPP) |
GDP growth (real) |
Inflation rate (in Percent) |
Government debt (in % of GDP) |
|---|---|---|---|---|---|
| 1980 | 9.8 | 974 | n/a | ||
| 1981 | n/a | ||||
| 1982 | n/a | ||||
| 1983 | n/a | ||||
| 1984 | n/a | ||||
| 1985 | n/a | ||||
| 1986 | n/a | ||||
| 1987 | n/a | ||||
| 1988 | n/a | ||||
| 1989 | n/a | ||||
| 1990 | 28.3% | ||||
| 1991 | |||||
| 1992 | |||||
| 1993 | |||||
| 1994 | |||||
| 1995 | |||||
| 1996 | |||||
| 1997 | |||||
| 1998 | |||||
| 1999 | |||||
| 2000 | |||||
| 2001 | |||||
| 2002 | |||||
| 2003 | |||||
| 2004 | |||||
| 2005 | |||||
| 2006 | |||||
| 2007 | |||||
| 2008 | |||||
| 2009 | |||||
| 2010 | |||||
| 2011 | |||||
| 2012 | |||||
| 2013 | |||||
| 2014 | |||||
| 2015 | |||||
| 2016 | |||||
| 2017 |
Imports and Exports
Ghana's top export products in 2016 were crude petroleum ($2.66B), gold ($2.39B), cocoa beans ($2.27B), cocoa paste ($382M) and cocoa butter ($252M). Ghana's top export destinations in 2016 were Switzerland ($1.73B), China ($1.06B), France ($939M), India ($789M) and the Netherlands ($778M).[49]
Ghana's top import categories in 2016 were refined petroleum ($2.18B), crude petroleum ($546M), gold ($428M), rice ($328M) and packaged medicaments ($297M). The nations with the highest value of imports to Ghana in 2016 were China ($4.1B), the Netherlands ($1.58B), the United States ($1.1B), Nigeria ($920M) and India ($668M).[49]
Private banking
The financial services in Ghana have seen a lot of reforms in the past years. The Banking (Amendment) Act 2007 included the awarding of a general banking license to qualified banks, which allows only indigenous Ghana offshore banks to operate in country Ghana. Indigenous Ghana private bank Capital Bank was the first to be awarded the general banking license in Ghana as well as indigenous Ghana private banks UniBank, National Investment Bank and Prudential Bank Limited. It has therefore become possible for Ghanaian non-resident individuals or residents and foreign companies or indigenous Ghana companies to open indigenous Ghana offshore bank accounts in Ghana.[36] Indigenous Ghana retail and savings banks include Agricultural Development Bank of Ghana, CAL Bank, GCB Bank Ltd, Home Finance Company and UT Bank as well as indigenous Ghana savings and loan institutions ABii National and Savings and Loans Company.[36]
Stock exchange
The Stock Exchange of Ghana is one of the largest in Africa, with a market capitalization of GH¢57.2 billion or CN¥180.4 billion in 2012. South Africa's JSE Limited is the largest.[50]
Energy
Zdroj:https://en.wikipedia.org?pojem=Economy_of_Ghana>Text je dostupný pod licencí Creative Commons Uveďte autora – Zachovejte licenci, případně za dalších podmínek. Podrobnosti naleznete na stránce Podmínky užití.
Text je dostupný za podmienok Creative
Commons Attribution/Share-Alike License 3.0 Unported; prípadne za ďalších
podmienok.
Podrobnejšie informácie nájdete na stránke Podmienky
použitia.

