A | B | C | D | E | F | G | H | CH | I | J | K | L | M | N | O | P | Q | R | S | T | U | V | W | X | Y | Z | 0 | 1 | 2 | 3 | 4 | 5 | 6 | 7 | 8 | 9
Wyandot County | |
|---|---|
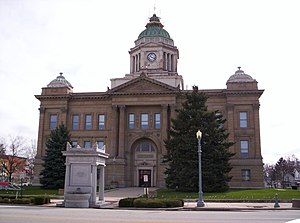
 Wyandot County Courthouse in Upper Sandusky | |
 Location within the U.S. state of Ohio | |
 Ohio's location within the U.S. | |
| Coordinates: 40°51′N 83°18′W / 40.85°N 83.3°W | |
| Country | |
| State | |
| Founded | February 3, 1845[1] |
| Named for | the Wyandot people |
| Seat | Upper Sandusky |
| Largest city | Upper Sandusky |
| Area | |
| • Total | 408 sq mi (1,060 km2) |
| • Land | 407 sq mi (1,050 km2) |
| • Water | 0.7 sq mi (2 km2) 0.2% |
| Population (2020) | |
| • Total | 21,900 |
| • Density | 54/sq mi (21/km2) |
| Time zone | UTC−5 (Eastern) |
| • Summer (DST) | UTC−4 (EDT) |
| Congressional districts | 4th, 5th |
| Website | www |
Wyandot County is a county located in the northwestern part of the U.S. state of Ohio. As of the 2020 census, the population was 21,900.[2] Its county seat is Upper Sandusky.[3] It was named for the Wyandot Indians, who lived here before and after European encounter. Their autonym is variously translated from their language as "around the plains" and "dwellers on the peninsula".[4] The county was organized by the state legislature from parts of Crawford, Marion, Hardin and Hancock counties on February 3, 1845.
History
This section is empty. You can help by adding to it. (May 2019) |
Geography
According to the U.S. Census Bureau, the county has a total area of 408 square miles (1,060 km2), of which 407 square miles (1,050 km2) is land and 0.7 square miles (1.8 km2) (0.2%) is water.[5]
Adjacent counties
- Seneca County (north)
- Crawford County (east)
- Marion County (south)
- Hardin County (southwest)
- Hancock County (northwest)
Demographics
| Census | Pop. | Note | %± |
|---|---|---|---|
| 1850 | 11,194 | — | |
| 1860 | 15,596 | 39.3% | |
| 1870 | 18,553 | 19.0% | |
| 1880 | 22,395 | 20.7% | |
| 1890 | 21,722 | −3.0% | |
| 1900 | 21,125 | −2.7% | |
| 1910 | 20,760 | −1.7% | |
| 1920 | 19,481 | −6.2% | |
| 1930 | 19,036 | −2.3% | |
| 1940 | 19,218 | 1.0% | |
| 1950 | 19,785 | 3.0% | |
| 1960 | 21,648 | 9.4% | |
| 1970 | 21,826 | 0.8% | |
| 1980 | 22,651 | 3.8% | |
| 1990 | 22,254 | −1.8% | |
| 2000 | 22,908 | 2.9% | |
| 2010 | 22,615 | −1.3% | |
| 2020 | 21,900 | −3.2% | |
| U.S. Decennial Census[6] 1790-1960[7] 1900-1990[8] 1990-2000[9] 2020 [2] | |||
2000 census
As of the census[10] of 2000, there were 22,908 people, 8,882 households, and 6,270 families living in the county. The population density was 56 people per square mile (22 people/km2). There were 9,324 housing units at an average density of 23 units per square mile (8.9/km2). The racial makeup of the county was 97.91% White, 0.14% Black or African American, 0.08% Native American, 0.50% Asian, 0.74% from other races, and 0.62% from two or more races. 1.46% of the population were Hispanic or Latino of any race. 45.6% were of German, 19.5% American, 7.0% English and 6.9% Irish ancestry according to Census 2000.
There were 8,882 households, out of which 33.10% had children under the age of 18 living with them, 57.90% were married couples living together, 9.20% had a female householder with no husband present, and 29.40% were non-families. 25.40% of all households were made up of individuals, and 11.70% had someone living alone who was 65 years of age or older. The average household size was 2.53 and the average family size was 3.03.
In the county, the population was spread out, with 25.80% under the age of 18, 8.20% from 18 to 24, 27.90% from 25 to 44, 22.70% from 45 to 64, and 15.40% who were 65 years of age or older. The median age was 37 years. For every 100 females there were 95.10 males. For every 100 females age 18 and over, there were 92.50 males.
The median income for a household in the county was $38,839, and the median income for a family was $45,173. Males had a median income of $31,716 versus $22,395 for females. The per capita income for the county was $17,170. About 3.80% of families and 5.50% of the population were below the poverty line, including 5.20% of those under age 18 and 5.10% of those age 65 or over.
2010 census
As of the 2010 United States Census, there were 22,615 people, 9,091 households, and 6,236 families living in the county.[11] The population density was 55.6 inhabitants per square mile (21.5 inhabitants/km2). There were 9,870 housing units at an average density of 24.3 units per square mile (9.4 units/km2).[12] The racial makeup of the county was 96.9% white, 0.6% Asian, 0.2% American Indian, 0.2% black or African American, 1.1% from other races, and 1.0% from two or more races. Those of Hispanic or Latino origin made up 2.2% of the population.[11] In terms of ancestry, 43.3% were German, 11.8% were American, 11.2% were Irish, and 8.6% were English.[13]
Of the 9,091 households, 32.1% had children under the age of 18 living with them, 53.2% were married couples living together, 10.2% had a female householder with no husband present, 31.4% were non-families, and 26.5% of all households were made up of individuals. The average household size was 2.46 and the average family size was 2.95. The median age was 40.5 years.[11]
The median income for a household in the county was $47,216 and the median income for a family was $57,461. Males had a median income of $40,320 versus $30,027 for females. The per capita income for the county was $22,553. About 4.6% of families and 8.2% of the population were below the poverty line, including 11.0% of those under age 18 and 8.2% of those age 65 or over.[14]
Politics
From 1856 to 1916, Wyandot County was consistently Democratic, voting for the party's candidates in every presidential election in that span. Since 1916, it has become a strongly Republican county, voting for Republican presidential candidates in all but three elections that were national landslides for the Democratic Party, & none since 1964.
| Year | Republican | Democratic | Third party | |||
|---|---|---|---|---|---|---|
| No. | % | No. | % | No. | % | |
| 2020 | 8,462 | 74.21% | 2,733 | 23.97% | 208 | 1.82% |
| 2016 | 7,468 | 70.20% | 2,515 | 23.64% | 655 | 6.16% |
| 2012 | 6,180 | 58.29% | 4,137 | 39.02% | 285 | 2.69% |
| 2008 | 6,270 | 56.99% | 4,461 | 40.55% | 271 | 2.46% |
| 2004 | 7,254 | 65.69% | 3,708 | 33.58% | 81 | 0.73% |
| 2000 | 6,113 | 62.21% | 3,397 | 34.57% | 317 | 3.23% |
| 1996 | 4,473 | 46.56% | 3,677 | 38.27% | 1,457 | 15.17% |
| 1992 | 4,411 | 42.24% | 3,031 | 29.02% | 3,001 | 28.74% |
| 1988 | 6,178 | 66.87% | 2,936 | 31.78% | 125 | 1.35% |
| 1984 | 7,204 | 74.81% | 2,342 | 24.32% | 84 | 0.87% |
| 1980 | 5,786 | 63.06% | 2,757 | 30.05% | 632 | 6.89% |
| 1976 | 5,661 | 56.92% | 4,043 | 40.65% | 242 | 2.43% |
| 1972 | 6,414 | 68.15% | 2,771 | 29.44% | 227 | 2.41% |
| 1968 | 5,265 | 57.90% | 2,919 | 32.10% | 910 | 10.01% |
| 1964 | 4,139 | 43.98% | 5,273 | 56.02% | 0 | 0.00% |
| 1960 | 6,786 | 65.81% | 3,526 | 34.19% | 0 | 0.00% |
| 1956 | 6,807 | 73.18% | 2,495 | 26.82% | 0 | 0.00% |
| 1952 | 7,015 | 71.64% | 2,777 | 28.36% | 0 | 0.00% |
| 1948 | 4,849 | 59.26% | 3,308 | 40.43% | 25 | 0.31% |
| 1944 | 6,144 | 65.54% | 3,231 | 34.46% | 0 | 0.00% |
| 1940 | 6,272 | 59.86% | 4,206 | 40.14% | 0 | 0.00% |
| 1936 | 4,260 | 41.42% | 5,597 | 54.41% | 429 | 4.17% |
| 1932 | 3,939 | 41.42% | 5,451 | 57.32% | 119 | 1.25% |
| 1928 | 5,790 | 65.41% | 3,024 | 34.16% | 38 | 0.43% |
| 1924 | 3,973 | 50.86% | 3,271 | 41.88% | 567 | 7.26% |
| 1920 | 4,560 | 50.50% | 4,443 | 49.21% | 26 | 0.29% |
| 1916 | 2,078 | 38.68% | 3,250 | 60.50% | 44 | 0.82% |
| 1912 | 1,409 | 26.94% | 2,848 | 54.46% | 973 | 18.60% |
| 1908 | 2,408 | 41.36% | 3,353 | 57.59% | 61 | 1.05% |
| 1904 | 2,603 | 47.90% | 2,697 | 49.63% | 134 | 2.47% |
| 1900 | 2,397 | 41.68% | 3,268 | 56.82% | 86 | 1.50% |
| 1896 | 2,374 | 40.44% | 3,441 | 58.62% | 55 | 0.94% |


