A | B | C | D | E | F | G | H | CH | I | J | K | L | M | N | O | P | Q | R | S | T | U | V | W | X | Y | Z | 0 | 1 | 2 | 3 | 4 | 5 | 6 | 7 | 8 | 9
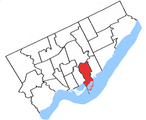
 Location in Toronto | |||
| Federal electoral district | |||
| Legislature | House of Commons | ||
| MP |
Liberal | ||
| District created | 1976 | ||
| First contested | 1979 | ||
| Last contested | 2021 | ||
| District webpage | profile, map | ||
| Demographics | |||
| Population (2021)[1] | 105,472 | ||
| Electors (2015) | 76,567 | ||
| Area (km²)[2] | 19.75 | ||
| Pop. density (per km²) | 5,340.4 | ||
| Census division(s) | Toronto | ||
| Census subdivision(s) | Toronto | ||
.gif)
Toronto–Danforth (formerly Broadview–Greenwood) is a federal electoral district in Ontario, Canada, that has been represented in the House of Commons of Canada since 1979. It lies to the east of Downtown Toronto. Its best-known MP was New Democratic Party (NDP) leader and Leader of the Opposition Jack Layton.
Toronto–Danforth includes an array of ethnicities, including large Greek, Chinese, and South Asian communities, many of the latter of whom are Muslims. It has the highest percentage of ethnic Greeks among all Toronto ridings (7.3%).
Historically, the riding has tilted to the left, particularly since the 1990s. Most election contests take place between the NDP and the Liberal Party. Even with the end of vote-splitting on the centre-right, the Conservatives are almost nonexistent in the riding; no Conservative candidate has crossed the 15 percent mark.
The NDP held the riding for the first nine years of its existence before Liberal Dennis Mills won the seat in 1988 and held it during the long period of Liberal dominance of the federal scene. He was unseated in 2004 by Layton, who had previously run against Mills in 1997. Layton held the seat until his death on August 22, 2011. The seat was vacant until a by-election on March 29, 2012, which was won by NDP candidate and human rights lawyer Craig Scott. However, Scott was narrowly defeated by Liberal Julie Dabrusin in the 2015 election in a major upset.
Demographics
- According to the 2021 Canadian census[3]
Ethnic groups: 63.4% White, 11.2% Chinese, 5.8% South Asian, 5.3% Black, 2.4% Filipino, 2.3% Indigenous, 2.0% Southeast Asian, 1.6% Latin American
Languages: 65.9% English, 5.4% Cantonese, 3.7% Greek, 2.0% Mandarin, 1.9% French, 1.6% Spanish, 1.0% Tagalog
Religions: 39.5% Christian (16.5% Catholic, 7.8% Christian Orthodox, 3.1% Anglican, 2.3% United Church, 9.8% Other), 4.7% Muslim, 2.7% Buddhist, 2.6% Jewish, 1.1% Hindu, 48.2% none
Median income: $45,600 (2020)
Average income: $70,800 (2020)
History
The riding was created in 1976 as "Broadview—Greenwood" from parts of Broadview and York East and a small part of Greenwood.
It consisted initially of the part of the Municipality of Metropolitan Toronto bounded on the south by Queen Street East, on the west by the Don River, and on the east and north by a line drawn north from Queen Street along Jones Avenue, east along Gerrard Street East, north along Greenwood Avenue, west along O'Connor Drive, north along Don Mills Road to the Don River.
In 1987, it was redefined to consist of the part of the City of Toronto and the Borough of East York bounded on the west by the Don River, on the south by Queen Street, and on the east and north by a line drawn from the lake north along Leslie Street, east along Queen Street East, north along Greenwood Avenue, east along Danforth Avenue, north along Coxwell Avenue and Coxwell Boulevard, and west along Taylor Creek and the Don River East Branch to the Don River.
In 1996, it was defined to consist of the parts of the City of Toronto and the Borough of East York north along Leslie Street, east along Queen Street East, north along Greenwood Avenue, east along Gerrard Street East, north along Coxwell Avenue and Coxwell Boulevard, west along Taylor Creek, the Don River East Branch and the Don River, northwest along Millwood Road, southwest along the Canadian Pacific Railway and the eastern limit of the City of Toronto, south along the Don River to Toronto Harbour.
The name of the electoral district was changed in 2000 to "Toronto—Danforth" on the suggestion of Dennis Mills, the riding's Member of Parliament. Many local citizens were upset at the name change, particularly because of the lack of public say in the matter. Layton sought neighbourhood input for another name change to the riding, but the name was not changed.
In 2003, it was given its current boundaries, which consist of the part of the City of Toronto bounded on the south by Lake Ontario and Toronto Harbour, on the east by Coxwell Avenue and Coxwell Boulevard, on the north by Taylor Creek and the Don River East Branch, and on the west by the Don River. This riding was unchanged after the 2012 electoral redistribution.
Former boundaries
-
 1976 to 1987
 -
 1987 to 1996
 -
 1996 to 2003
 -
 2003 to 2015


Members of Parliament
This riding has elected the following members of Parliament:
| Parliament | Years | Member | Party | |
|---|---|---|---|---|
| Broadview—Greenwood Riding created from Broadview, York East and Greenwood |
||||
| 31st | 1979–1980 | Bob Rae | New Democratic | |
| 32nd | 1980–1982 | |||
| 1982–1984 | Lynn McDonald | |||
| 33rd | 1984–1988 | |||
| 34th | 1988–1993 | Dennis Mills | Liberal | |
| 35th | 1993–1997 | |||
| 36th | 1997–2000 | |||
| Toronto—Danforth | ||||
| 37th | 2000–2004 | Dennis Mills | Liberal | |
| 38th | 2004–2006 | Jack Layton | New Democratic | |
| 39th | 2006–2008 | |||
| 40th | 2008–2011 | |||
| 41st | 2011–2011 | |||
| 2012–2015 | Craig Scott | |||
| 42nd | 2015–2019 | Julie Dabrusin | Liberal | |
| 43rd | 2019–2021 | |||
| 44th | 2021–present | |||
Election results
Graphs are unavailable due to technical issues. There is more info on Phabricator and on MediaWiki.org. |
Toronto—Danforth, 2000–present
Graphs are unavailable due to technical issues. There is more info on Phabricator and on MediaWiki.org. |
| 2021 Canadian federal election | ||||||||
|---|---|---|---|---|---|---|---|---|
| Party | Candidate | Votes | % | ±% | Expenditures | |||
| Liberal | Julie Dabrusin | 23,038 | 48.41 | +0.58 | $77,319.65 | |||
| New Democratic | Clare Hacksel | 15,881 | 33.28 | +0.08 | $94,784.85 | |||
| Conservative | Michael Carey | 6,105 | 12.83 | +2.29 | $25,348.44 | |||
| People's | Wayne Simmons | 1,238 | 2.59 | +1.49 | $766.61 | |||
| Green | Maryem Tollar | 949 | 1.99 | -4.51 | $2,899.08 | |||
| Communist | Elizabeth Rowley | 204 | 0.43 | +0.13 | $0.00 | |||
| Animal Protection | Liz White | 179 | 0.38 | -0.02 | $3,315.07 | |||
| Independent | Habiba Desai | 125 | 0.26 | $510.82 | ||||
| Total valid votes/expense limit | 47,719 | – | – | $110,583.29 | ||||
| Total rejected ballots | ||||||||
| Turnout | 47,719 | 59.84 | ||||||
| Eligible voters | 79,749 | |||||||
| Source: Elections Canada[4] | ||||||||
| 2021 federal election redistributed results[5] | |||
|---|---|---|---|
| Party | Vote | % | |
| Liberal | 25,216 | 48.36 | |
| New Democratic | 17,556 | 33.67 | |
| Conservative | 6,548 | 12.56 | |
| People's | 1,282 | 2.46 | |
| Green | 1,023 | 1.96 | |
| Others | 521 | 1.00 | |
| 2019 Canadian federal election | ||||||||
|---|---|---|---|---|---|---|---|---|
| Party | Candidate | Votes | % | ±% | Expenditures | |||
| Liberal | Julie Dabrusin | 27,681 | 47.7 | +5.36 | $75,766 | |||
| New Democratic | Min Sook Lee | 19,283 | 33.2 | -6.97 | $102,067 | |||
| Conservative | Zia Choudhary | 6,091 | 10.5 | +0.64 | $19,351 | |||
| Green | Chris Tolley | 3,761 | 6.5 | +1.79 | ||||
| People's | Tara Dos Remedios | 621 | 1.1 | - | $3,633 | |||
| Animal Protection | Elizabeth Abbott | 261 | 0.4 | -0.24 | $2,645 | |||
| Independent | John Kladitis | 210 | 0.4 | - | $2,953 | |||
| Communist | Ivan Byard | 151 | 0.3 | - | ||||
| Total valid votes/expense limit | 58,059 | 100.0 | ||||||
| Total rejected ballots | 413 | |||||||
| Turnout | 58,472 | 71.9 | ||||||
| Eligible voters | 81,283 | |||||||
| Liberal hold | Swing | +6.17 | ||||||
| Source: Elections Canada[6][7] | ||||||||
| 2015 Canadian federal election | ||||||||
|---|---|---|---|---|---|---|---|---|
| Party | Candidate | Votes | % | ±% | Expenditures | |||
| Liberal | Julie Dabrusin | 23,531 | 42.34 | +24.75 | $76,557.98 | |||
| New Democratic | Craig Scott | 22,325 | 40.17 | -20.70 | $177,088.37 | |||
| Conservative | Benjamin Dichter | 5,478 | 9.86 | -4.44 | $7,898.04 | |||
| Green | Chris Tolley | 2,618 | 4.71 | -1.74 | $8,441.33 | |||
| Progressive Canadian | John Richardson | 1,275 | 2.29 | – | – | |||
| Animal Alliance | Elizabeth Abbott | 354 | 0.64 | – | $216.83 | |||
| Total valid votes/expense limit | 55,581 | 100.00 | $210,111.71 | |||||
| Total rejected ballots | 269 | 0.48 | – | |||||
| Turnout | 55,850 | 72.38 | – | |||||
| Eligible voters | 77,158 | |||||||
| Liberal gain from New Democratic | Swing | +22.73 | ||||||
| Source: Elections Canada[8][9] | ||||||||
| Canadian federal by-election, March 19, 2012: Toronto—Danforth Death of Jack Layton | ||||||||
|---|---|---|---|---|---|---|---|---|
| Party | Candidate | Votes | % | ±% | Expenditures | |||
| New Democratic | Craig Scott | 19,210 | 59.44 | −1.36 | $ 82,847.22 | |||
| Liberal | Grant Gordon | 9,215 | 28.51 | +10.89 | 86,016.54 | |||
| Conservative | Andrew Keyes | 1,736 | 5.37 | −8.95 | 73,735.56 | |||
| Green | Adriana Mugnatto-Hamu | 1,517 | 4.69 | −1.77 | 57,955.38 | |||
| Progressive Canadian | Dorian Baxter | 208 | 0.64 | – | 1,473.73 | |||
| Libertarian | John C. Recker | 133 | 0.41 | – | 2,433.05 | |||
| Independent | Leslie Bory | 77 | 0.24 | – | 898.69 | |||
| Canadian Action | Christopher Porter | 75 | 0.23 | – | 3,163.57 | |||
| Independent | John Turmel | 57 | 0.18 | – | – | |||
| United | Brian Jedan | 55 | 0.17 | – | 130.18 | |||
| Independent | Bahman Yazdanfar | 36 | 0.11 | – | 622.86 | |||
| Total valid votes/expense limit | 32,319 | 100.00 | $ 86,821.95 | |||||
| Total rejected ballots | 150 | 0.46 | −0.13 | |||||
| Turnout | 32,469 | 43.58 | −21.32 | |||||
| New Democratic hold | Swing | −6.1 | ||||||
Source(s)
"By-election March 19, 2012 – Official Voting Results". Elections Canada. Retrieved October 29, 2014. "Financial Reports: Candidate's Electoral Campaign Return – March 19, 2012 By-election". Retrieved October 29, 2014. | ||||||||
| 2011 Canadian federal election | ||||||||
|---|---|---|---|---|---|---|---|---|
| Party | Candidate | Votes | % | ±% | Expenditures | |||
| New Democratic | Jack Layton | 29,235 | 60.80 | +16.02 | $ 71,037.96 | |||
| Liberal | Andrew Lang | 8,472 | 17.62 | -11.76 | 62,218.04
Zdroj:https://en.wikipedia.org?pojem=Toronto—Danforth_(federal_electoral_district) >Text je dostupný pod licencí Creative Commons Uveďte autora – Zachovejte licenci, případně za dalších podmínek. Podrobnosti naleznete na stránce Podmínky užití. čítajte viac o Toronto—Danforth_(federal_electoral_district)
Text je dostupný za podmienok Creative
Commons Attribution/Share-Alike License 3.0 Unported; prípadne za ďalších
podmienok. | |||

